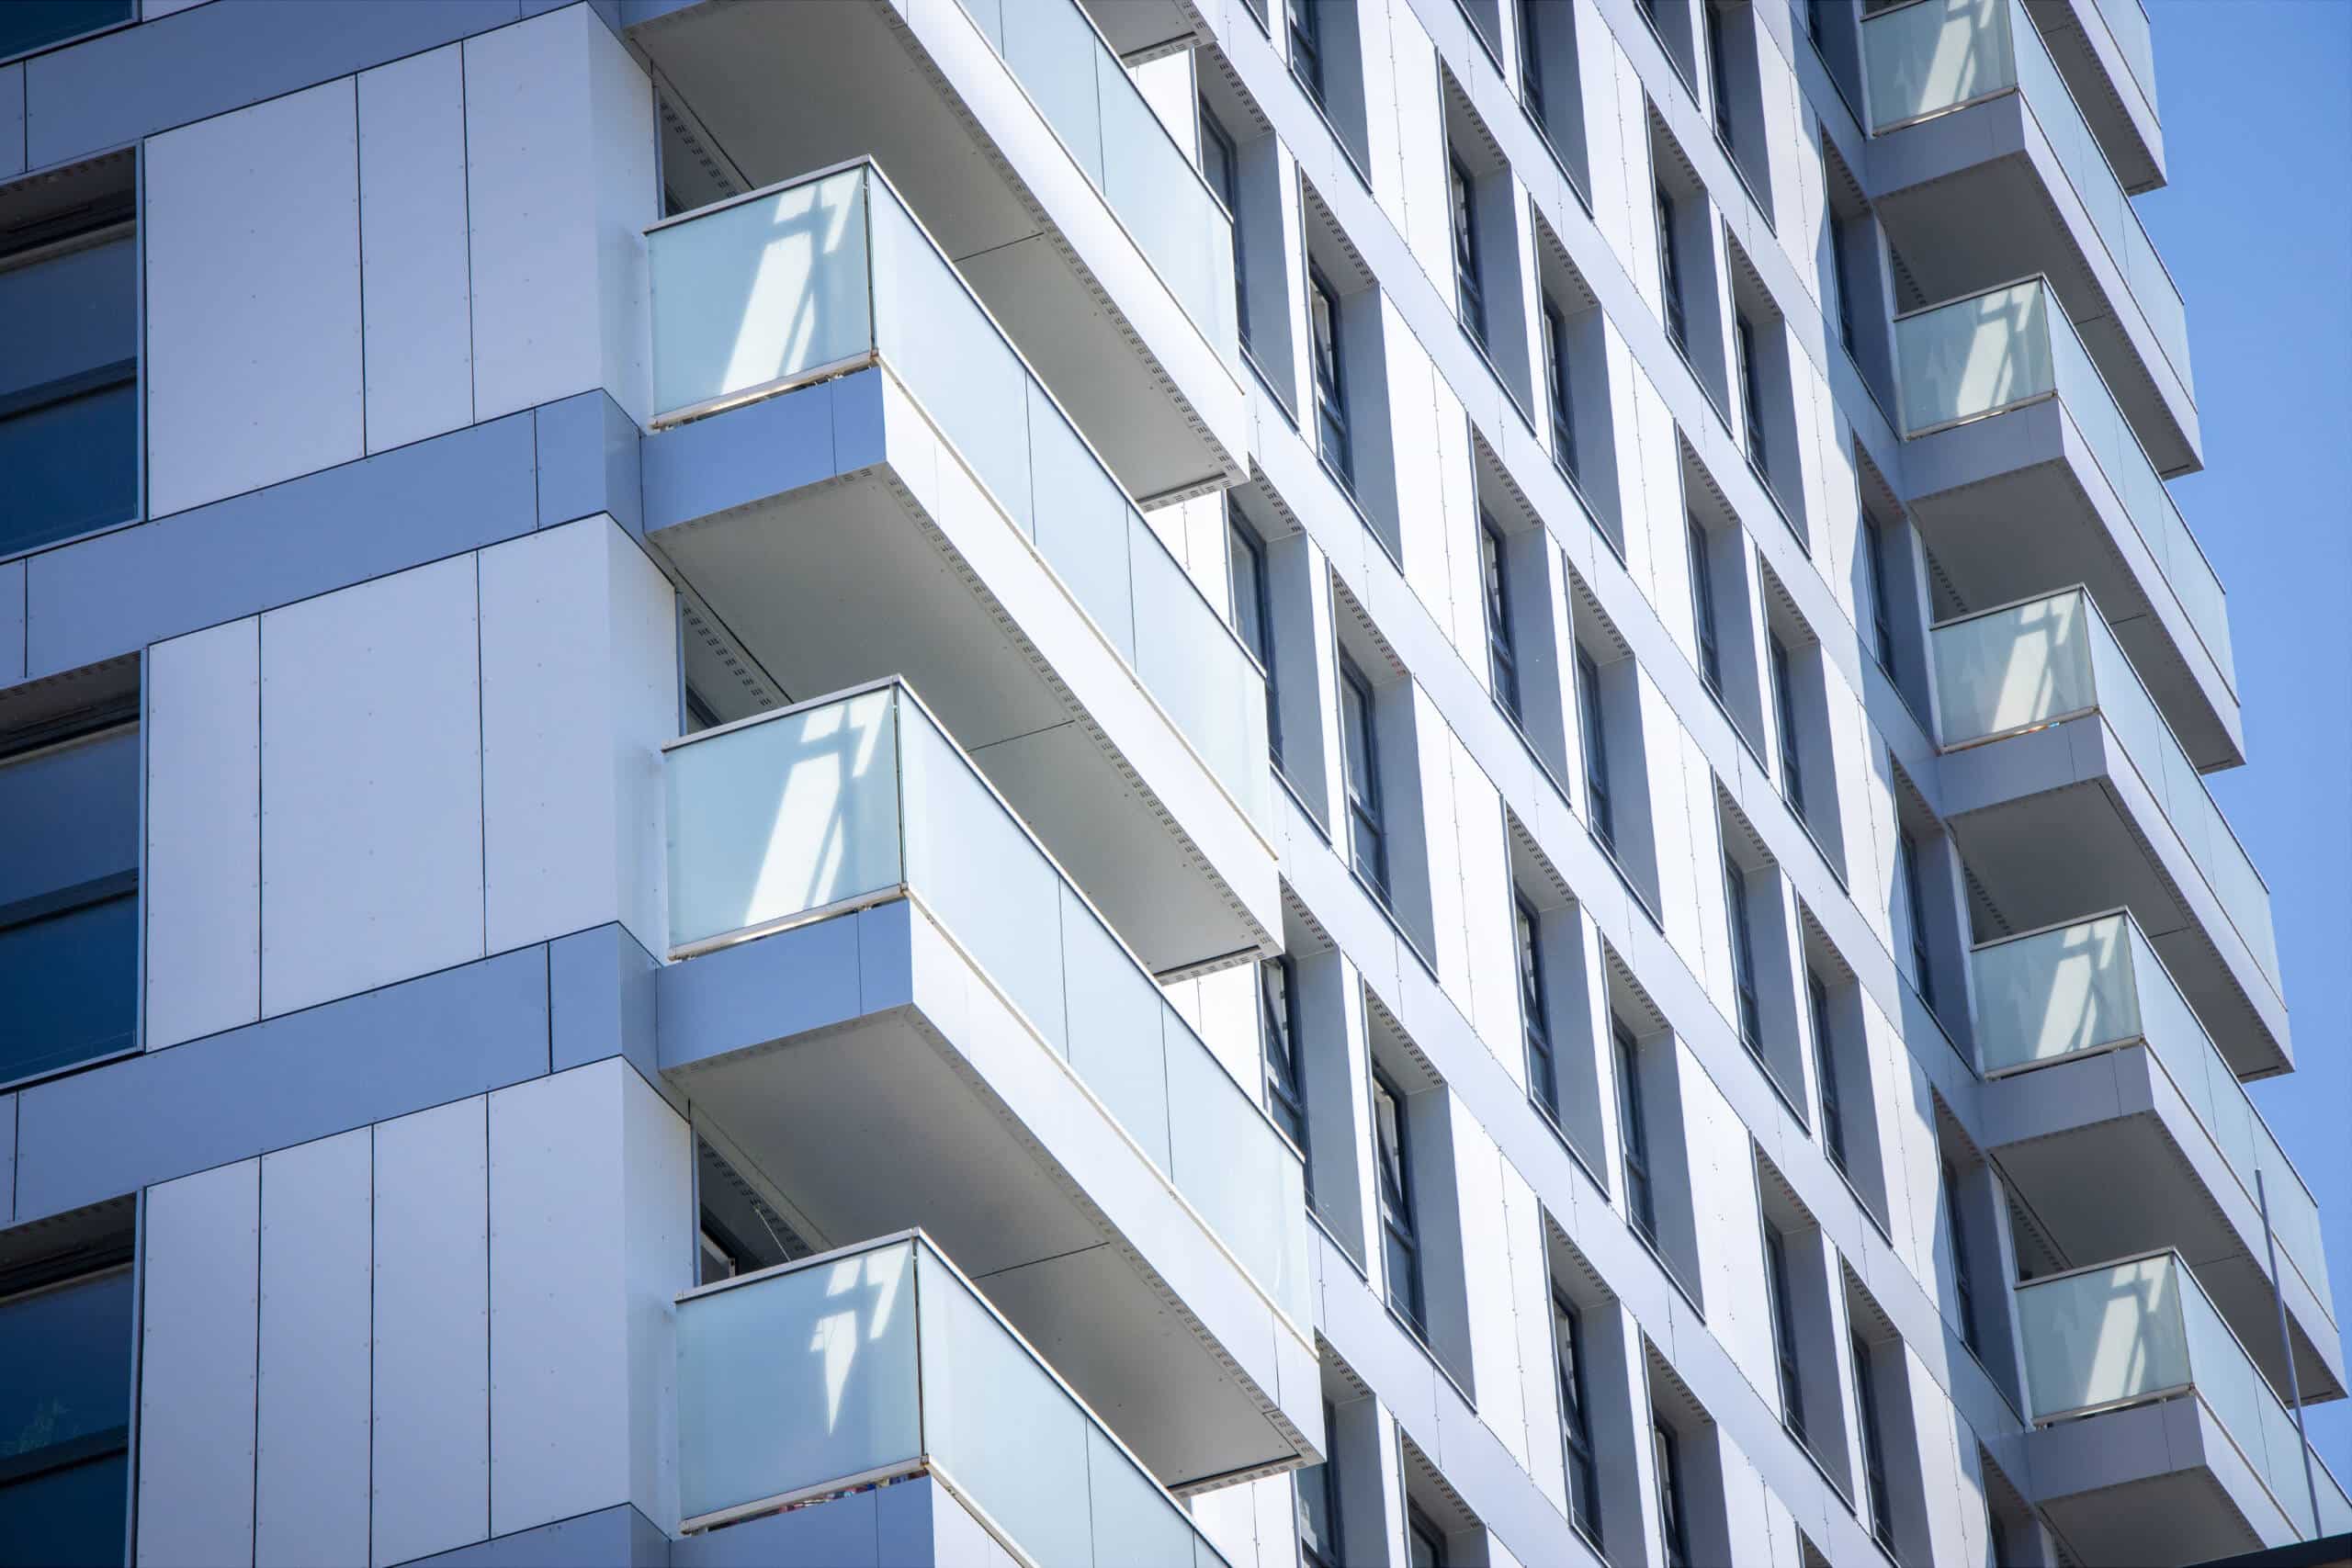
In our most recent research, it has unveiled shocking findings around the costs and severity of the current UK cladding crisis. London being one of the worst city for cladding issues in the UK.
We calculated this Index by using official UK government data to determine the number of properties with dangerous cladding. This was done by taking an average of the maximum and minimum estimates for the number of buildings with ACM cladding systems yet to be remediated. The average salary data for each affected area was then collected from the ONS and converted to monthly, weekly and annual wages for leaseholders.
Cladding Issues | |||||||||
Ranking | Local Authority | Population | Ave. Number of buildings with ACM cladding – yet to be remediated | Buildings per 10,000 people | Ave. Earnings per week | Ave. Earnings per month | Ave. Earnings per year | Average Cost Of Cladding Remidiation | Percentage of Leaseholder Salary Compared To Cost Of Remidiation |
1 | City of London | 10,938 | 3 | 2.74 | £870.00 | £3,770.00 | £45,240.00 | £42,000.00 | 92.84% |
2 | Tower Hamlets | 331,969 | 20+ | 0.60 | £768.00 | £3,328.00 | £39,936.00 | £42,000.00 | 105.17% |
3 | Salford | 262,697 | 15.5 | 0.59 | £442.00 | £1,915.33 | £22,984.00 | £42,000.00 | 182.74% |
4 | Westminster | 269,848 | 15.5 | 0.57 | £635.00 | £2,751.67 | £33,020.00 | £42,000.00 | 127.20% |
5 | Wandsworth | 329,735 | 15.5 | 0.47 | £505.00 | £2,188.33 | £26,260.00 | £42,000.00 | 159.94% |
6 | Brent | 327,753 | 15.5 | 0.47 | £482.00 | £2,088.67 | £25,064.00 | £42,000.00 | 167.57% |
7 | Newham | 355,266 | 15.5 | 0.44 | £456.00 | £1,976.00 | £23,712.00 | £42,000.00 | 177.13% |
8 | Southwark | 320,017 | 8 | 0.25 | £645.00 | £2,795.00 | £33,540.00 | £42,000.00 | 125.22% |
9 | Elmbridge | 137,215 | 3 | 0.22 | £508.00 | £2,201.33 | £26,416.00 | £42,000.00 | 158.99% |
10 | Slough | 149,577 | 3 | 0.20 | £541.00 | £2,344.33 | £28,132.00 | £42,000.00 | 149.30% |
11 | Reading | 160,337 | 3 | 0.19 | £519.00 | £2,249.00 | £26,988.00 | £42,000.00 | 155.62% |
12 | Hammersmith and Fulham | 183,544 | 3 | 0.16 | £560.00 | £2,426.67 | £29,120.00 | £42,000.00 | 144.23% |
13 | Merton | 206,453 | 3 | 0.15 | £448.00 | £1,941.33 | £23,296.00 | £42,000.00 | 180.29% |
14 | Manchester | 555,741 | 8 | 0.14 | £476.00 | £2,062.67 | £24,752.00 | £42,000.00 | 169.68% |
15 | Luton | 213,528 | 3 | 0.14 | £415.00 | £1,798.33 | £21,580.00 | £42,000.00 | 194.62% |
16 | Sutton | 207,707 | 3 | 0.14 | £440.00 | £1,906.67 | £22,880.00 | £42,000.00 | 183.57% |
17 | Trafford | 237,579 | 3 | 0.13 | £391.00 | £1,694.33 | £20,332.00 | £42,000.00 | 206.57% |
18 | Harrow | 252,338 | 3 | 0.12 | £371.00 | £1,607.67 | £19,292.00 | £42,000.00 | 217.71% |
19 | Islington | 248,115 | 3 | 0.12 | £626.00 | £2,712.67 | £32,552.00 | £42,000.00 | 129.02% |
20 | Hackney | 280,941 | 3 | 0.11 | £508.00 | £2,201.33 | £26,416.00 | £42,000.00 | 158.99% |
21 | Camden | 279,516 | 3 | 0.11 | £617.00 | £2,673.67 | £32,084.00 | £42,000.00 | 130.91% |
22 | Milton Keynes | 270,203 | 3 | 0.11 | £476.00 | £2,062.67 | £24,752.00 | £42,000.00 | 169.68% |
23 | Haringey | 266,357 | 3 | 0.11 | £479.00 | £2,075.67 | £24,908.00 | £42,000.00 | 168.62% |
24 | Plymouth | 262,839 | 3 | 0.11 | £429.00 | £1,859.00 | £22,308.00 | £42,000.00 | 188.27% |
25 | Lewisham | 305,309 | 3 | 0.10 | £474.00 | £2,054.00 | £24,648.00 | £42,000.00 | 170.40% |
26 | Brighton and Hove | 291,738 | 3 | 0.10 | £419.00 | £1,815.67 | £21,788.00 | £42,000.00 | 192.77% |
27 | Greenwich | 289,034 | 3 | 0.10 | £474.00 | £2,054.00 | £24,648.00 | £42,000.00 | 170.40% |
28 | Ealing | 340,341 | 3 | 0.09 | £479.00 | £2,075.67 | £24,908.00 | £42,000.00 | 168.62% |
29 | Nottingham | 337,098 | 3 | 0.09 | £400.00 | £1,733.33 | £20,800.00 | £42,000.00 | 201.92% |
30 | Bromley | 332,752 | 3 | 0.09 | £464.00 | £2,010.67 | £24,128.00 | £42,000.00 | 174.07% |
31 | Lambeth | 321,813 | 3 | 0.09 | £585.00 | £2,535.00 | £30,420.00 | £42,000.00 | 138.07% |
32 | Barnet | 399,007 | 3 | 0.08 | £458.00 | £1,984.67 | £23,816.00 | £42,000.00 | 176.35% |
33 | Bournemouth, Christchurch and Poole | 396,989 | 3 | 0.08 | £384.00 | £1,664.00 | £19,968.00 | £42,000.00 | 210.34% |
34 | Croydon | 388,563 | 3 | 0.08 | £459.00 | £1,989.00 | £23,868.00 | £42,000.00 | 175.97% |
35 | Kirklees | 441,290 | 3 | 0.07 | £343.00 | £1,486.33 | £17,836.00 | £42,000.00 | 235.48% |
36 | Bradford | 542,128 | 3 | 0.06 | £384.00 | £1,664.00 | £19,968.00 | £42,000.00 | 210.34% |
37 | Liverpool | 500,474 | 3 | 0.06 | £414.00 | £1,794.00 | £21,528.00 | £42,000.00 | 195.09% |
38 | Bristol, City of | 465,866 | 3 | 0.06 | £455.00 | £1,971.67 | £23,660.00 | £42,000.00 | 177.51% |
39 | Sheffield | 589,214 | 3 | 0.05 | £408.00 | £1,768.00 | £21,216.00 | £42,000.00 | 197.96% |
40 | Leeds | 798,786 | 3 | 0.04 | £446.00 | £1,932.67 | £23,192.00 | £42,000.00 | 181.10% |
41 | Birmingham | 1,140,525 | 3 | 0.03 | £447.00 | £1,937.00 | £23,244.00 | £42,000.00 | 180.69% |
42 | Leicester | 354,036 | 0 | 0.00 | £403.00 | £1,746.33 | £20,956.00 | £42,000.00 | 200.42% |
43 | Sandwell | 329,042 | 0 | 0.00 | £385.00 | £1,668.33 | £20,020.00 | £42,000.00 | 209.79% |
44 | Doncaster | 312,785 | 0 | 0.00 | £361.00 | £1,564.33 | £18,772.00 | £42,000.00 | 223.74% |
45 | Hillingdon | 309,014 | 0 | 0.00 | £546.00 | £2,366.00 | £28,392.00 | £42,000.00 | 147.93% |
46 | Newcastle upon Tyne | 306,824 | 0 | 0.00 | £410.00 | £1,776.67 | £21,320.00 | £42,000.00 | 197.00% |
47 | Redbridge | 305,658 | 0 | 0.00 | £434.00 | £1,880.67 | £22,568.00 | £42,000.00 | 186.10% |
48 | Medway | 279,142 | 0 | 0.00 | £422.00 | £1,828.67 | £21,944.00 | £42,000.00 | 191.40% |
49 | Sunderland | 277,846 | 0 | 0.00 | £396.00 | £1,716.00 | £20,592.00 | £42,000.00 | 203.96% |
50 | Waltham Forest | 276,940 | 0 | 0.00 | £386.00 | £1,672.67 | £20,072.00 | £42,000.00 | 209.25% |
51 | Sefton | 275,899 | 0 | 0.00 | £368.00 | £1,594.67 | £19,136.00 | £42,000.00 | 219.48% |
52 | Hounslow | 271,767 | 0 | 0.00 | £580.00 | £2,513.33 | £30,160.00 | £42,000.00 | 139.26% |
53 | Wolverhampton | 264,407 | 0 | 0.00 | £378.00 | £1,638.00 | £19,656.00 | £42,000.00 | 213.68% |
54 | Havering | 260,651 | 0 | 0.00 | £421.00 | £1,824.33 | £21,892.00 | £42,000.00 | 191.85% |
55 | Oldham | 237,628 | 0 | 0.00 | £346.00 | £1,499.33 | £17,992.00 | £42,000.00 | 233.44% |
56 | Portsmouth | 214,692 | 0 | 0.00 | £439.00 | £1,902.33 | £22,828.00 | £42,000.00 | 183.98% |
57 | Barking and Dagenham | 214,107 | 0 | 0.00 | £473.00 | £2,049.67 | £24,596.00 | £42,000.00 | 170.76% |
58 | Calderdale | 211,439 | 0 | 0.00 | £383.00 | £1,659.67 | £19,916.00 | £42,000.00 | 210.89% |
59 | Gateshead | 201,950 | 0 | 0.00 | £401.00 | £1,737.67 | £20,852.00 | £42,000.00 | 201.42% |
60 | Stockton-on-Tees | 197,419 | 0 | 0.00 | £400.00 | £1,733.33 | £20,800.00 | £42,000.00 | 201.92% |
61 | Kingston upon Thames | 179,142 | 0 | 0.00 | £441.00 | £1,911.00 | £22,932.00 | £42,000.00 | 183.15% |
62 | Bedford | 174,687 | 0 | 0.00 | £397.00 | £1,720.33 | £20,644.00 | £42,000.00 | 203.45% |
63 | Kensington and Chelsea | 156,864 | 0 | 0.00 | £512.00 | £2,218.67 | £26,624.00 | £42,000.00 | 157.75% |
64 | Dacorum | 155,457 | 0 | 0.00 | £423.00 | £1,833.00 | £21,996.00 | £42,000.00 | 190.94% |
65 | Windsor and Maidenhead | 151,273 | 0 | 0.00 | £518.00 | £2,244.67 | £26,936.00 | £42,000.00 | 155.93% |
66 | Norwich | 142,177 | 0 | 0.00 | £365.00 | £1,581.67 | £18,980.00 | £42,000.00 | 221.29% |
67 | Lincoln | 100,049 | 0 | 0.00 | £361.00 | £1,564.33 | £18,772.00 | £42,000.00 | 223.74% |
One of the most notable discoveries was that the typical cladding repair bill is an estimated £42,000 per property – which is 180% more than the average leaseholder salary. In addition, the Index’s salary data shows that the repair costs would be the same as 91 weeks of wages per person, on average and does not include any shipping issues that might be caused by the recent material shortage in the UK.
Alan Lamming, Director of Valcan commented: “The data is clearly very shocking and although the government recently announced a £5bn investment to foot the bill for cladding that needs remediating, it is clear this is not enough and many leaseholders will be left to pay large sums of money that they simply cannot afford.”
Whether or not the government’s funding proves sufficient to rectify the situation remains to be seen, but if it isn’t, many leaseholders will find themselves in challenging financial circumstances based on the above data. On top of this, many of these homeowners will now face a doubly anxious wait to both find out if this repair work is something they may have to pay for and when it will actually be carried out.